Problem
Manual reports took hours to build and often were out-of-date; stakeholders waited for weekly snapshots.
Solution
Power BI reports connected to Synapse gold-layer views (DirectQuery) with DAX measures and multiple pages for different business needs.
Outcome
Faster decision cycles and reduced reporting time — ~€11.0k estimated annual benefit (time + fewer follow-ups).
Technology Stack
Implementation Approach
Here's how we designed and built this solution:
- Power BI (.pbix) built on Synapse gold views using DirectQuery for near real-time dashboards.
- DAX measures, bookmarks and multi-page layouts to serve executives, ops and finance.
- Published report with role-level security and scheduled refresh for cached visuals where needed.
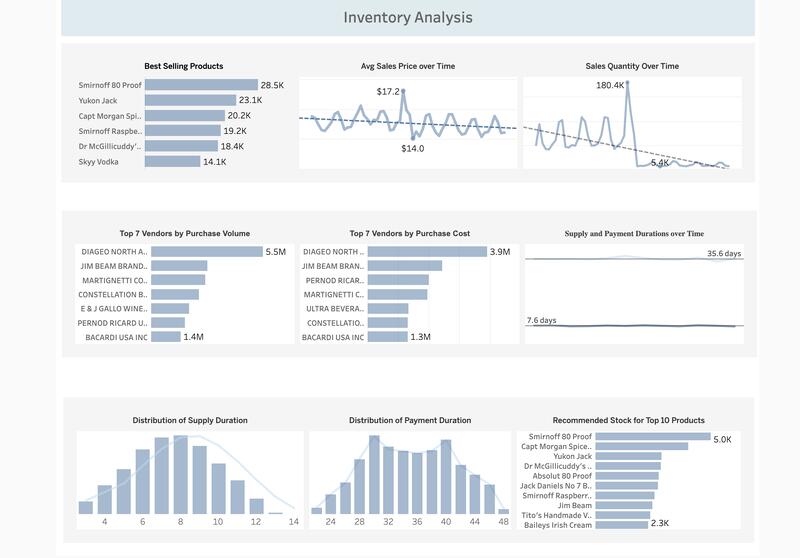
Solution Showcase
📸 Solution View
💡 Want to see this in action? Book a demo to explore the full solution.
Could This Work for Your Business?
If you have:
Manual processes eating 10+ hours/week
If you use:
Microsoft 365 (Teams, SharePoint, Excel)
If you want:
Similar results in 5-20 days
Then yes — let's talk.
Book Free 30-Min Audit
Ready to Transform Your Business?
Get Similar Results for Your Business
Book a free 30-minute discovery scan to uncover quick wins in your processes, data, and automation opportunities.
No commitment required
30-minute call
Instant actionable insights